 Build of the Month
 Recent Blue Posts
 Season of Discovery Hotfixes - 23 April
 Season of Discovery Hotfixes - April 23
 Recent Forum Posts
 WoW as Free to Play in the model of Hearthstone

No blue post today as it was a holiday week-end, at this point we're just waiting for Patch 4.1 to hit the PTRs anyway. (Or official Patch 4.1 previews, I guess!)
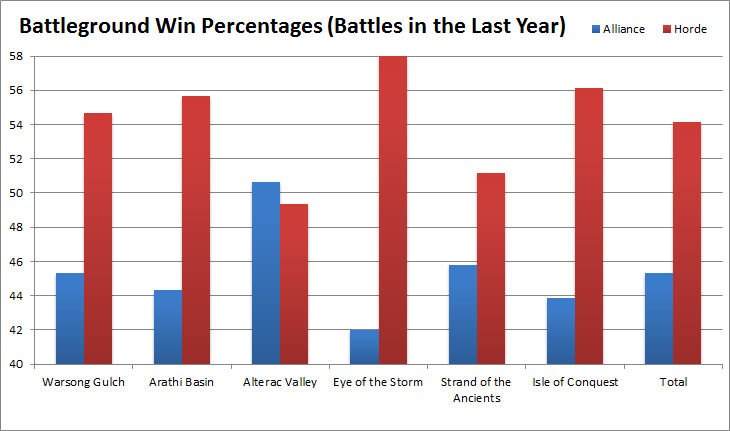
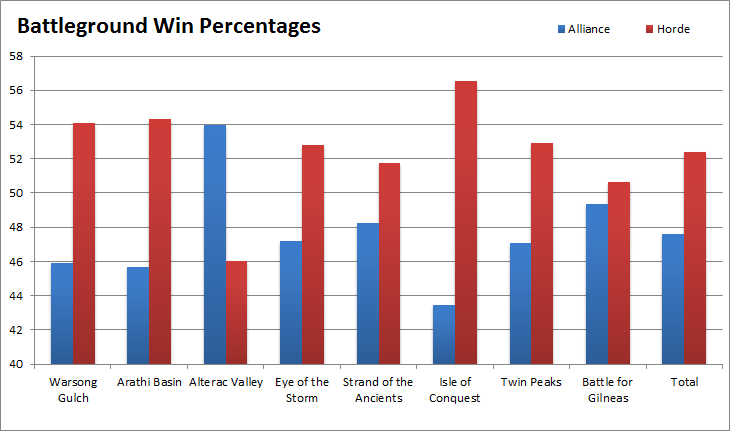
Battleground Horde/Alliance Win Ratio
People often wonder what the Horde/Alliance win ratio in battlegrounds are, Blizzard never gave away those % but the question can be answered by scanning a lot of characters on the Armory and compiling their battlegrounds wins statistics.
- 1. The first scan has been made a year ago.
- 2. The "Battles in the Last Year" graph is basically this month's scan minus the results of last year's scan. Deleted/transfered characters were removed from the stats.
- 3. Even if the amount of people scanned is huge, don't take these stats as a 100% truth. Only Blizzard can be 100% sure of that, especially since it's very hard to gather a lot of data from the Armory.
- 4. Before you yell on forums, make sure you look at the % on the left, the lowest % is 42% and the highest is 58%.
The "Battlegrounds Wins in the Last Year" graph is the only thing you should look at if you want an idea of how things are balanced these days.
Computers - Setup of the Month (by chaud)
Each month or every 2 months, depending on the hardware evolutions, the lovely chaud will work on a couple of hardware setups for those of you who are thinking of upgrading their computer!
This month
Sandy Bridge motherboards were recalled because of a flaw in one of the SATA ports (see Sandy Bridge). They will not be available for purchase at least until March or April. New SSDs are almost here, faster and more expensive than the current generation.
Make sure to keep your AMD and Nvidia drivers up to date.
Don't hesitate to post any feedback in the comments of that news post, and don't forget to visit the Computer Forum for any extra questions!
Peripherals/Monitors
| Component | Puppy | Dolphin |
|---|---|---|
| Monitor | ASUS VW224U 22-Inch Widescreen - $148 | ASUS VW246H 24-Inch Widescreen - $200 |
| Keyboard | Microsoft Digital Media Keyboard 3000 - $25 | Cyborg V.5 - $38 |
| Mouse | Logitech MX518 - $22 | Logitech G500 - $54 |
| Speakers | Logitech S220 2.1 Speaker System - $28 | Logitech Z313 Speaker System - $40 |
| Component | Narwhal | Unicorn |
| Monitor | Dell E2311H 23-inch LED-backlit Widescreen - $315 | Dell UltraSharp U2410 24-inch (IPS Panel) - $560 |
| Keyboard | Logitech G110 - $65 | Razer BlackWidow (Backlit)- $73 ($120) |
| Mouse | Razer Deathadder - $47 | Razer Naga (Buttons on the Side) - $70 |
| Speakers | Creative Inspire T3130 2.1 Speaker System - $50 | Logitech Speaker System Z523 - $83 |
Puppy and Dolphin
| Component | Puppy | Dolphin |
|---|---|---|
| Case | NZXT GAMMA Classic - $40 | NZXT GAMMA Classic - $40 |
| Power Supply | Corsair 650TX - $60 | Corsair 650TX - $60 |
| CPU | AMD Athlon II X4 635 AM3 - $100 | AMD Phenom II X4 955 Black Edition - $140 |
| Heatsink | Cooler Master Hyper 212 Plus - $28 | Cooler Master Hyper 212 Plus - $28 |
| Motherboard | GIGABYTE GA-770T-USB3 AM3 - $90 | GIGABYTE GA-890GPA-UD3H AM3 - $135 |
| Memory | 4GB PNY Optima DDR3 10600 - $35 | 4GB G.Skill Ripjaws F3 4GB 12800 DDR3 - $58 |
| Graphics Card | XFX 5770 - $137 | XFX 6850 or EVGA GTX 460 - $177 / $222 |
| Hard Drive | Western Digital Caviar Blue 500 GB - $40 | SAMSUNG Spinpoint F3 1TB - $62 |
| DVD | Lite-On LightScribe 24X SATA DVD+/-RW - $25 | Lite-On LightScribe 24X SATA DVD+/-RW - $25 |
| Total | $555 | $725 / $770 |
Narwhal and Unicorn
| Component | Narwhal | Unicorn |
|---|---|---|
| Case | Cooler Master Centurion 5 II - $61 | Cooler Master HAF932 - $120 |
| Power Supply | Corsair 650TX - $60 | Corsair 750HX (7 Year Warranty) - $127 |
| CPU | Intel i5-760 - $210 | Intel i7-950 - $300 |
| Heatsink | Tuniq Tower 120 Extreme - $59 | Noctua 6 NH-D14 - $85 |
| Motherboard | ASUS P7P55D-E - $156 | Asus Sabertooth X58 (5 Year Warranty) - $211 |
| Memory | 4GB G.Skill Ripjaws F3 4GB 12800 DDR3 - $58 | 6GB G.Skill DDR3 12800 - $88 |
| Graphics Card | XFX 6950 1GB OR EVGA GTX 560 Ti- $265 / $275 | XFX 6970 - $365 OR EVGA GTX 570 - $380 |
| Hard Drive | Western Digital 1TB Caviar Black - $88 | Western Digital 1TB Caviar Black - $87 |
| SSD | None | OCZ Vertex 2 120 GB (Review) - $239 OR Corsair Force 120GB (Review) - $217 |
| DVD | Lite-On LightScribe 24X SATA DVD+/-RW - $25 | Lite-On LightScribe 24X SATA DVD+/-RW - $25 |
| Total | $982/ $992 | $1647/ $1662 |


vBulletin Message